Chapter 11
definitions
Box Plot- A graph that shows how data are distributed by using the median, quartiles, least value, and greatest value.
Interquartile Range- The difference between the upper and lower quartiles in a box plot.
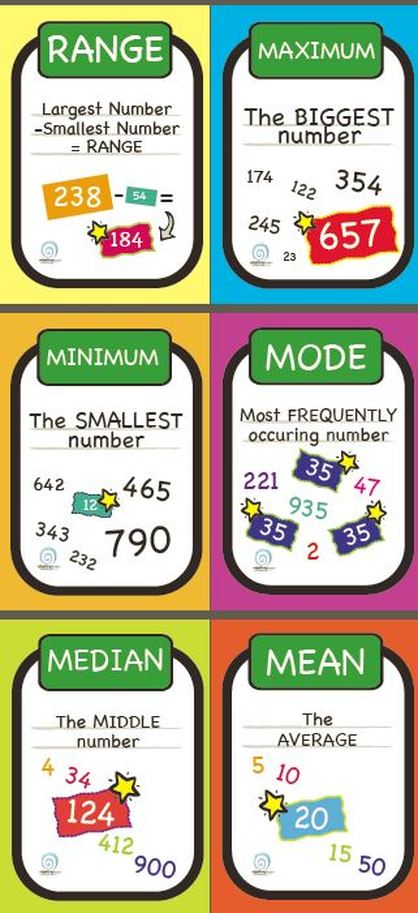
Mean- The sum of the items in a set of data divided by the number of items in the set; also called average.
Mean Absolute Deviation- The mean distance between each data value and the mean of the data set.
Median- The middle number, or the mean (average) of the two middle numbers, in an ordered set of data.
Interquartile Range- The difference between the upper and lower quartiles in a box plot.
Mean- The sum of the items in a set of data divided by the number of items in the set; also called average.
Mean Absolute Deviation- The mean distance between each data value and the mean of the data set.
Median- The middle number, or the mean (average) of the two middle numbers, in an ordered set of data.